Resume Maker
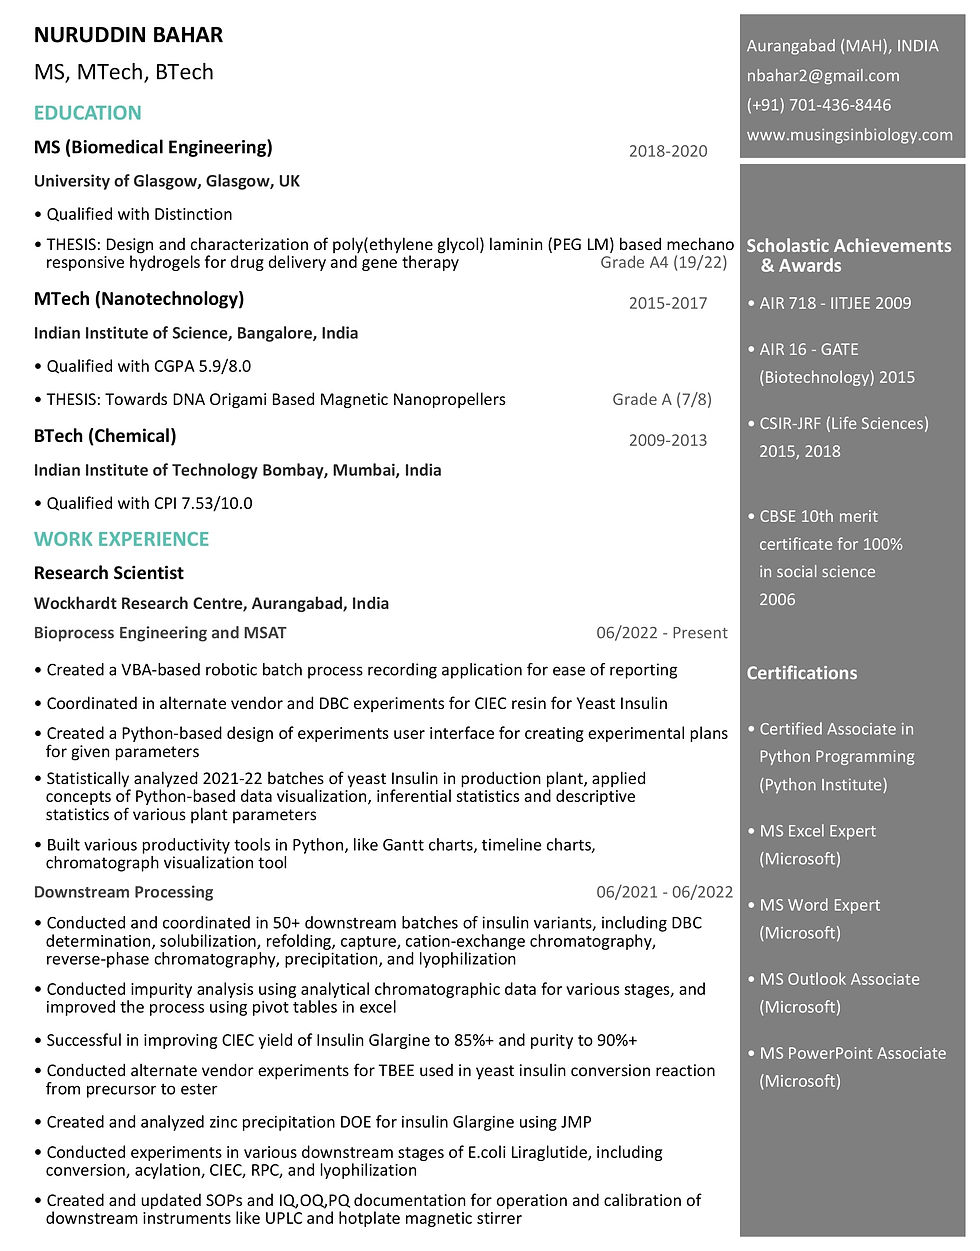
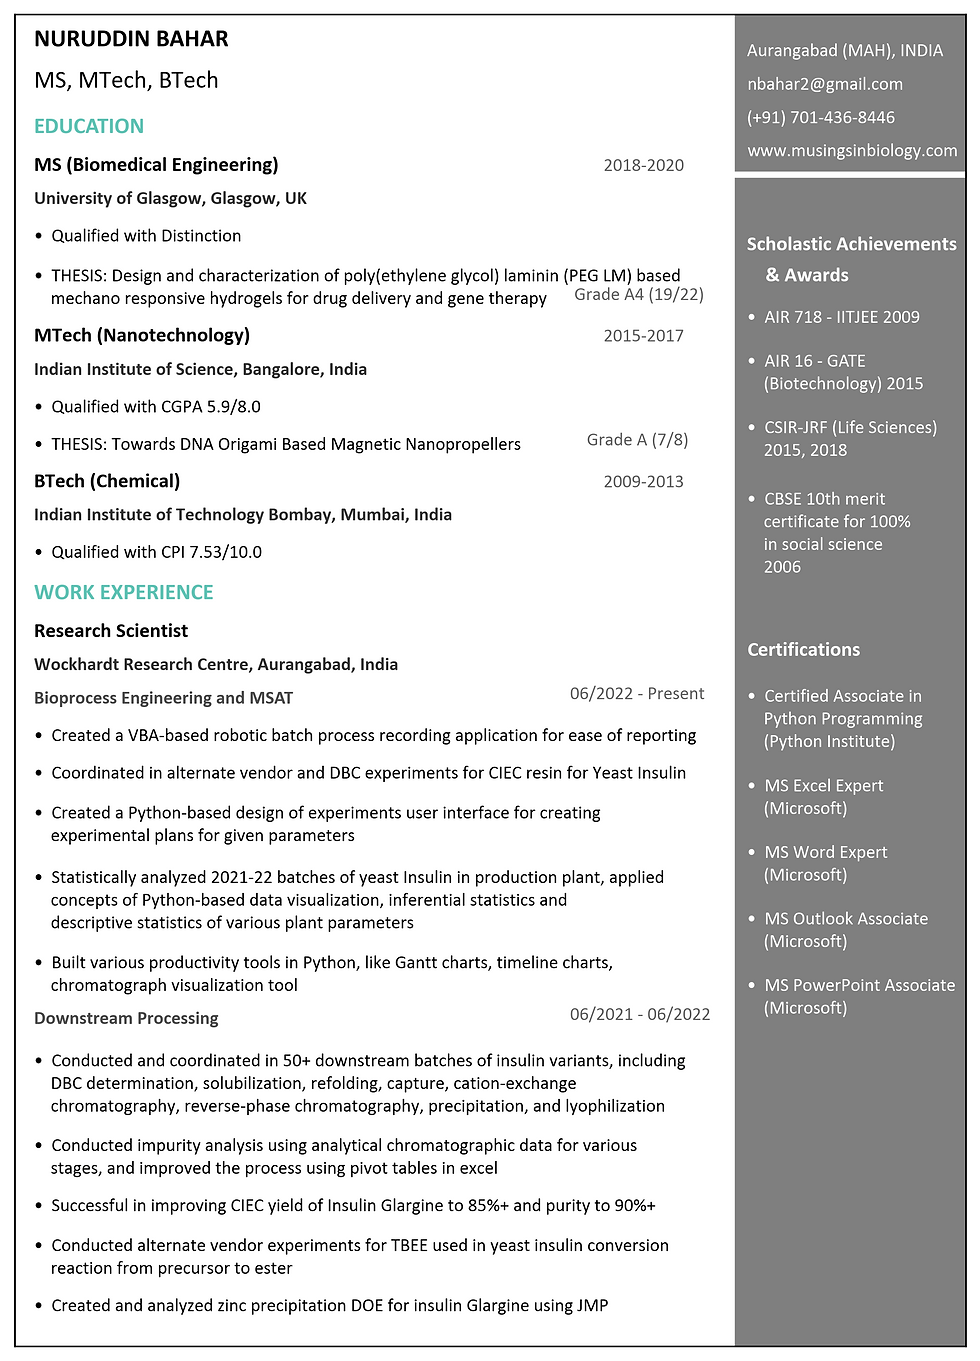
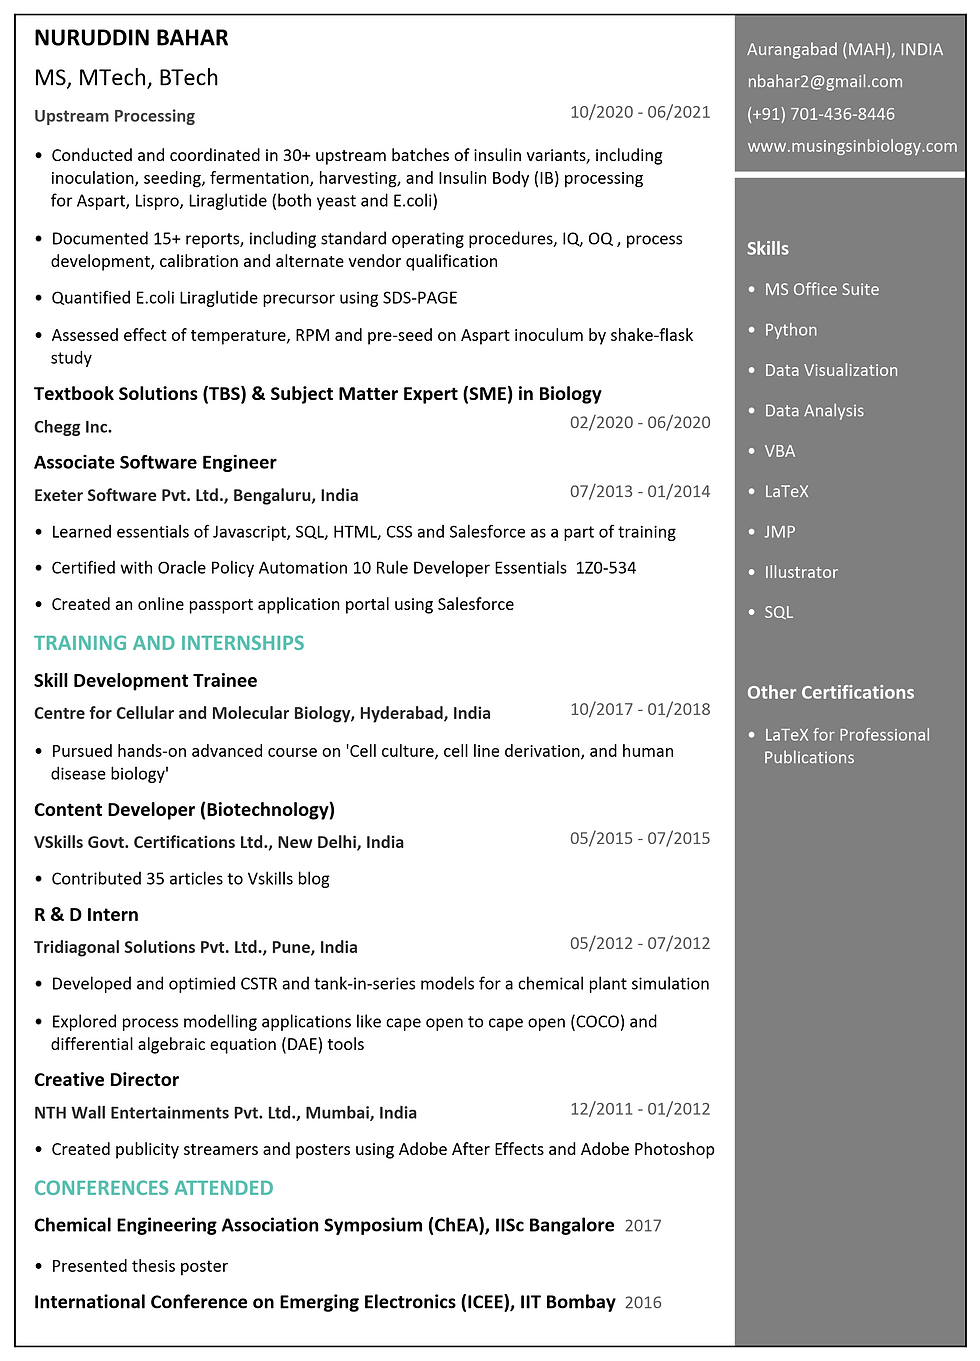
Based on an Excel table, I have created a resume using simple Python coding, which can be extended to multiple pages.
Motivation
As I began working on my resume, I explored various online portals for inspiration. While browsing through different styles and formats, I came across premium versions that were quite expensive, particularly for an average Indian. I wanted to find a more cost-effective solution, and that's when I thought of using Python programming to create my own resume.
Idea
I searched for online resumes made using Python and found various implementations.
Utilize a matplotlib plot of the same size as an A4 sheet and leverage Python's built-in annotate functionality to position text effectively.
Explore a convenient method to add text to the plot without manual coding for each line. One approach is to use an Excel table and utilize the pandas dataframe functionality to retrieve the text.
Implement positioning parameters that include x-y coordinates to ensure proper placement of the fetched text.
Format different types of text in a distinct manner. For instance, consider using larger fonts for the name and designation, while keeping the resume content such as projects or work experience in a smaller font.
Highlight different sections of the resume using various formatting techniques. One approach is to include a 'content type' column in the text table.
Accommodate resumes with multiple pages by incorporating a 'Page' column to designate the placement of content on each page.
Enhance the plot by adding sidebars to emphasize achievements or skills. Implementing separate content for sidebars can improve usability.
Resume Excel Table
To simplify the process, I created an Excel workbook with three worksheets -
Data table of the resume designated by the person's name, in current case 'Nuruddin'.
Background data that created lists like 'Content_Type', 'Line_Position', and 'Font_Weight'.
Resume parameters that has a table defining parameters for each content type and line position combination of text.
Data table had four columns:
Line_Position: to denote location of text on the sheet. It was divided into - Left for the main content, Right Top for contact information, and Right Bottom for achievements and skills.
Content_Type: to classify the type of text.. It was divided into Name, Designation, Section, Title, Year, Subtitle, Subtitle2, and Point.
Content_Text: to provide the actual text for the resume.
Page to determine the page on which the content is to be placed.
Resume parameters table had eleven columns:
Line_Position: to denote location of text on the sheet. It was divided into - Left for the main content, Right Top for contact information, and Right Bottom for achievements and skills.
Content_Type: to classify the type of text.. It was divided into Name, Designation, Section, Title, Year, Subtitle, Subtitle2, and Point.
Spacing_Before: to determine the spacing before the placement of text.
Spacing_After: to determine the spacing after the placement of text.
Max_Character_Length: to deermine the character length for each combination. Change in font may affect the default values, as such the user needs to decide its values on the go.
Left_Indent: this value determines the x-coordinate in terms of how much the text needs indentation from the left of the A4 page.
Font_Weight: affects the weight of the font in terms of bold, light, medium, or regular.
Font_Size: affects the size of the font. Change in font may affect the default values, as such the user needs to decide its values on the go.
Font_Color: affects the default color of the combination of content type and position.
Alpha_Value: affects the opacity of the font. 1 is opaque, while 0 is transparent.
Line_Spacing: affects spacing between lines of the same type (if wrapped).
Using this format, I was able to create each page separately and efficiently with designated formats.
Pythonic Resume Maker
Import relevant libraries for creating resume.
import matplotlib.pyplot as plt  # for plotting
import matplotlib.font_manager as fm # for choosing fonts from those available in Python
from titlecase import titlecase # for formatting text types
import pandas as pd # for fetching data from Excel tables
import textwrap # for wrapping long lines of text to multiple lines
from PyPDF2 import PdfMerger # to merge separate PDFs into one
import io # for data caching

%matplotlib inline
Define a function that sets the font and creates a simple matplotlib plot having the size of an A4 sheet (8.3 inches by 11.7 inches).
def create_plot(font='Calibri', size=(8.5, 11)):
    plt.rcParams['font.family'] = font
    fig, ax = plt.subplots(figsize=size)
Next, add a vertical line and a horizontal line that would act as a space filling component of the resume. Also, format the lines to set the color to be white. In the end, remove x and y axes from the plot.
    # Decorative Lines
    ax.axvline(x=.5, ymin=0, ymax=1, color='#007ACC', alpha=0.0, linewidth=50)
    plt.axvline(x=1, color='#000000', alpha=0.5, linewidth=225)
    plt.axhline(y=.88, xmin=0, xmax=1, color='#ffffff', linewidth=3)

    # set background color
    ax.set_facecolor('white')

    # remove axes
    plt.axis('off')
Now, create a function that reads the two tables - the data table and the resume parameters. This is then merged later to create a content table along with resume parameters defined for each row of data.
def create_resume(name, font, year_or_date_justification_factor):

    df1 = pd.read_excel('Resume Data.xlsx', sheet_name=name, header=[0])
    df2 = pd.read_excel('Resume Data.xlsx', sheet_name='Resume_Parameters', header=[0])
    merged_df = pd.merge(df1, df2, on=['Line_Position', 'Content_Type'], how='left')
The merged data table looks like this:

The next task was to initialize y-coordinate parameters for each of the three sections:
    vertical_spacing_left = 0.75
    vertical_spacing_right_top = 1
    vertical_spacing_right_bottom = 0
Next, we define a variable that checks if a page is previous page. This is done in order to reassign the A4 plot for a new page.
prev_page = NoneNext, we define a universal variable for total number of lines on a given page. This will be used later while assigning fractional y-coordinates.
total_lines = 33Total number of pages are then defined uniquely in the form of a list.
pages = merged_df['Page'].unique()A PDFMerger object is defined to formulate newly created PDFs after code compilation.
merger = PdfMerger() # Create a PDF merger objectNext, a loop is defined that filters the data from the merged DataFrame based on the 'Page' value.
    for page in pages:
        filtered_df = merged_df[merged_df['Page'] == page]
Using iterrow method, values are assigned from each row of the filtered DataFrame.
    for index, value in filtered_df.iterrows():

        line_position = value['Line_Position']
        content_type = value['Content_Type']
        content_text = value['Content_Text']
        spacing_before = value['Spacing_Before']
        spacing_after = value['Spacing_After']
        max_char_length = value['Max_Character_Length']
        left_indent = value['Left_Indent']
        font_weight = value['Font_Weight']
        font_size = value['Font_Size']
        font_color = value['Font_Color']
        alpha_value = value['Alpha_Value']
        line_spacing = value['Line_Spacing']
        page = value['Page']
Next, we define a code that checks whether the page in the loop belongs to the previous page. If not, previous page variable is assigned a value of the current page. Also, since it is a new page, the y-coordinate spacing variables are reset to initial values. Additionally, the A4 plot is recreated using create_plot() function.
        if page != prev_page:
            vertical_spacing_left = 0.75
            vertical_spacing_right_top = 1
            vertical_spacing_right_bottom = 0

            create_plot(font, size=(8.5, 11))

            prev_page = page
Next, we define a nested function annotate_by_position() that has the y-coordinate variable as the first argument and a spacing factor as the second argument. This function is used later to annotate each row of text from the data table.
        def annotate_by_position(variable, factor):
            plt.annotate(content_text, \
                         (left_indent, \
                         (factor - (variable/total_lines))), \
                         weight=font_weight, \
                         fontsize = font_size, \
                         color=font_color, \
                         alpha=alpha_value,\
                         linespacing=line_spacing)
If the length of a line of text exceeds the geometry of the plot, they need to be wrapped. For this, a Python built-in textwrap module is used. Its wrap and fill methods take care of longer lines of text and wrap them up in next lines with a line break.
        if len(content_text) > max_char_length:
            m = textwrap.wrap(content_text, max_char_length, subsequent_indent='   ')
            content_text = ('\n' * 3).join(m) # line breaks are introduced for longer lines of text
            m = len(m)
            if content_type == 'Point':
                content_text = textwrap.fill(content_text, max_char_length, subsequent_indent='   ')
                # points are bulletted, hence an extra indentation is added
            else:
                content_text = textwrap.fill(content_text, max_char_length)
                # text that is not a point is not indented
            if line_position == 'Left':
                vertical_spacing_left += (m-1)*0.4 # y-coordinate variable is redefined for 'Left' text
            elif line_position == 'Right Bottom':
                vertical_spacing_right_bottom += (m - 1) # y-coordinate is redefined for 'Right Bottom' text
Some of the universal content types, irrespective of the line position, are modified by built-in string based methods prior to looping.
        if content_type in ['Name', 'Section']:
            content_text = content_text.upper() # Name and Section is modified to upper case texts
        elif content_type in ['Title', 'Subtitle','Subtitle2']:
            content_text = titlecase(content_text) # titles and subtitles are converted to titlecase texts
Looping code is provided for the 'Left' line position.
       if line_position == 'Left':

            if content_type in ['Point']:
                content_text = '• ' + content_text # adding bullets in front of text for points
            elif content_type in ['Year']:
                content_text = content_text.rjust(year_or_date_justification_factor)
                # year or date ranges are usually right-justified to the text adjacent to it
                # this is handled by a year_or_date_justification_factor which changes based on font

            vertical_spacing_left += spacing_before # spacing provided before the text
            annotate_by_position(vertical_spacing_left, 1) # annotating text based on nested function
            vertical_spacing_left += spacing_after # spacing provided after the text
Next, we annotate the right top and bottom sidebars.
        elif line_position == 'Right Top':

            vertical_spacing_right_top += spacing_before
            annotate_by_position(vertical_spacing_right_top, 1)
            vertical_spacing_right_top += spacing_after

        elif line_position == 'Right Bottom':

            if content_type in ['Point']:
                content_text = '• ' + content_text # adding bullets before points

            vertical_spacing_right_bottom += spacing_before
            annotate_by_position(vertical_spacing_right_bottom, 0.85)
            vertical_spacing_right_bottom += spacing_after
Lastly, we save the plots as PDFs. Here, instead of saving individual PDFs, we can directly save the figure to a BytesIO object.
    # Instead of saving individual PDFs, we can directly save the figure to a BytesIO object
    pdf_bytes = io.BytesIO()
    plt.savefig(pdf_bytes, format='pdf', dpi=300, bbox_inches='tight')
    plt.show()

    # Reset the buffer position to the beginning of the stream
    pdf_bytes.seek(0)

    # Append the PDF content from the BytesIO object to the merger object
    merger.append(pdf_bytes)
Ultimately, using PDFMerger() object's write method, we save the combined PDF file. With the name of the data table based worksheet, the font and string 'Resume_'.
    merged_filename = name + 'Resume_' + font +'.pdf'
    merger.write(merged_filename)  # Write the merged PDF to a file
    merger.close()  # Close the merger object
Now suppose we like three font styles, we can assign them in a loop and call the create_resume() function to save 3 separately styled PDFs.
for font, year_or_date_justification_factor in zip(['Tw Cen MT', 'STIXGeneral', 'Calibri'],[125, 142, 150]):
    create_resume('Nuruddin', font, year_or_date_justification_factor)
A sample PDF in "Calibri' font style is shown below:


Do find attached an Excel file that has the template that I used in creating my resume. Also find attached the full Python code.
NOTE : Although the resume is well-formatted, it does not pass well through an application tracking system, as I confirmed from an ATS score online. Any suggestions to make the resume more ATS-friendly are welcomed and appreciated.